- Measuring Growth
- Public Reports
- Restricted Reports
- Teacher Reports
- Student Reports
- Comparison Reports
- Roster Verification (RV)
- Getting Started
- Specifying Instructional Responsibility
- All Actions by Role
- All Actions for Teachers
- All Actions for School Administrators or Roster Approvers
- Manage teachers' access to RV
- Assign other school users the Roster Approver permission
- View a teacher's rosters
- Take control of a teacher's rosters
- Mark rosters as eligible or ineligible
- Add and remove rosters for a teacher
- Copy a roster
- Apply a percentage of instructional time to every student on a roster
- Batch print overclaimed and underclaimed students
- Remove students from a roster
- Add a student to a roster
- Return a teacher's rosters to the teacher
- Approve a teacher's rosters
- Submit your school's rosters to the district
- All Actions for district admin or district roster approvers
- Assign other district users the Roster Approver permission
- Take control of a school's rosters
- View a teacher's rosters
- View the history of a teacher's rosters
- Edit a teacher's rosters
- Mark rosters as eligible or ineligible
- Add and remove rosters for a teacher
- Copy a roster
- Apply a percentage of instructional time to every student on a roster
- Batch print overclaimed and underclaimed students
- Return a school's rosters to the school
- Approve rosters that you have verified
- Submit your district's rosters
- Understanding the RV Pages
- Viewing the History of Actions on Rosters
- Additional Resources
- General Help
Human Capital Retention Dashboard
Understanding the Report
Terms Used in the Report
Received the selected reports in the previous year only: Teachers who have value-added measures for the selected subject and grade at this school in the year before the selected reporting year, but not the most recent year. This does not always mean that a teacher left employment at that building; just that they did not receive a value-added report in this grade and subject in the most recent year.
Received the selected reports in both the previous year and the most recent year: Teachers who have value-added measures for the selected subject and grade at this school in both the previous year and the most recent year of reporting that you selected.
Received the selected reports in the most recent year only: Teachers who have value-added measures for the selected subject and grade at this school in the most recent year of reporting that you selected but not the previous year. This could mean that a teacher was newly hired or transferred from within the school to teach this grade and subject.
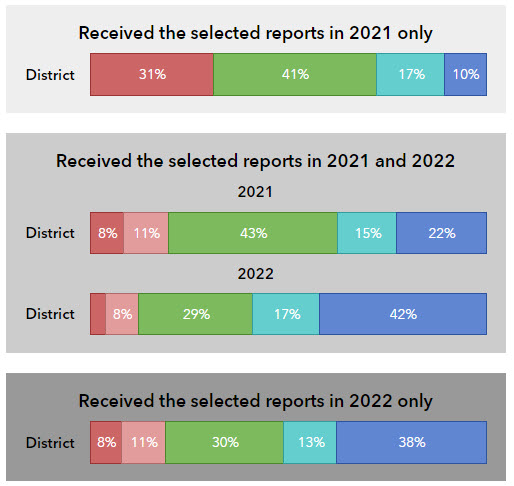
Understanding the Chart
Center of the Chart
The chart has up to three sections based on the year that you selected: teachers who received a report in the grade/subject in the previous year only, teachers who received a report in the grade/subject in both years, and teachers who received a report in the grade/subject in the most recent year only. If no teachers fit into one of these categories, that section of the report is not displayed.
The colors indicate the teachers' effectiveness levels. In this example, 11% of the teachers who received the selected reports in 2018 only in the selected school, test/subject, and grade were in the dark red range. This range indicates that there is significant evidence that students in these teachers' classes did not make Expected Growth.
School Pillar
Understanding the Table
The table contains the same data displayed in the chart and pillars.