- Measuring Growth
- Public Reports
- Restricted Reports
- Teacher Reports
- Student Reports
- Comparison Reports
- Roster Verification (RV)
- Getting Started
- Specifying Instructional Responsibility
- All Actions by Role
- All Actions for Teachers
- All Actions for School Administrators or Roster Approvers
- Manage teachers' access to RV
- Assign other school users the Roster Approver permission
- View a teacher's rosters
- Take control of a teacher's rosters
- Mark rosters as eligible or ineligible
- Add and remove rosters for a teacher
- Copy a roster
- Apply a percentage of instructional time to every student on a roster
- Batch print overclaimed and underclaimed students
- Remove students from a roster
- Add a student to a roster
- Return a teacher's rosters to the teacher
- Approve a teacher's rosters
- Submit your school's rosters to the district
- All Actions for district admin or district roster approvers
- Assign other district users the Roster Approver permission
- Take control of a school's rosters
- View a teacher's rosters
- View the history of a teacher's rosters
- Edit a teacher's rosters
- Mark rosters as eligible or ineligible
- Add and remove rosters for a teacher
- Copy a roster
- Apply a percentage of instructional time to every student on a roster
- Batch print overclaimed and underclaimed students
- Return a school's rosters to the school
- Approve rosters that you have verified
- Submit your district's rosters
- Understanding the RV Pages
- Viewing the History of Actions on Rosters
- Additional Resources
- General Help
| School Performance Diagnostic Summary | 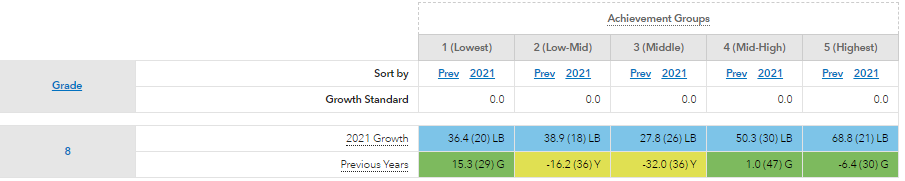 |
Understanding the Report
If you don't have access to this report, it does not appear in your Reports menu.
All schools with performance diagnostic data for the selected grade and subject or course are listed in the table. For each school, the table displays growth values for each expected performance level group from the School Performance Diagnostic report. Values are displayed for the most recent year and for previous years, when available. In each cell in the table, the first value is the growth value. The value in parentheses is the number of students in that expected performance level group.
The table is color-coded based on whether the data suggests the group of students exceeded, met, or fell short of expected growth, on average.
Diagnostic Color | Growth Measure Compared to Expected Growth | Interpretation |
|---|---|---|
Light Blue | At least one standard error above | Moderate evidence that the students made more growth than expected. |
Light Green | Between one standard error above and one standard error below | Evidence that the students made growth as expected. |
Light Red | More than one standard error below | Moderate evidence that the students made less growth than expected. |
White | N/A | Not enough students to generate a growth measure. |
For more information about the expected performance level groups, growth values, and colors, see School Performance Diagnostic: Understanding the Report.
By default, the schools in the table are listed alphabetically. You can sort the schools by the growth value for any group. To sort by the growth values for the most recent year, click the year link for the group you're interested in. To sort by the growth values for previous years, click the Prev link for the group you're interested in.
To view the data for a different test, subject, or grade, choose from the navigation tabs in the blue menu bar at the top of the report.
To view a school's Performance Diagnostic report, click on the school's name in the table.
Filtering by Student Group
By default, the report includes all of the School's students in the selected grade and subject or course who had sufficient data to be included in the report. Use the Add Student Groups filter to view the report for a subset of students.
To filter the list of students included in the report, click Select Student Groups above the table. In the Student Groups window, you can choose any combination of race, gender, and demographic groups.
If you choose more than one group within a category, the report includes students who are in either group. For example, if you choose Black or African American and Hispanic, the report includes both Black/African American students and Hispanic students.
If you choose multiple groups across categories, the report includes only students who are in the selected groups in all categories. For example, if you choose Male and Students with Disabilities, the report includes only males who are identified as students with disabilities.
When you are finished making selections, click Submit. The report includes only those groups of students you selected.
Even when viewing a filtered group of students, placement of students into the achievement groups is still based on students' relative achievement to students statewide in the selected grade and subject or course.