- Measuring Growth
- Public Reports
- Restricted Reports
- Teacher Reports
- Student Reports
- Comparison Reports
- Roster Verification (RV)
- Getting Started
- Specifying Instructional Responsibility
- All Actions by Role
- All Actions for Teachers
- All Actions for School Administrators or Roster Approvers
- Manage teachers' access to RV
- Assign other school users the Roster Approver permission
- View a teacher's rosters
- Take control of a teacher's rosters
- Mark rosters as eligible or ineligible
- Add and remove rosters for a teacher
- Copy a roster
- Apply a percentage of instructional time to every student on a roster
- Batch print overclaimed and underclaimed students
- Remove students from a roster
- Add a student to a roster
- Return a teacher's rosters to the teacher
- Approve a teacher's rosters
- Submit your school's rosters to the district
- All Actions for district admin or district roster approvers
- Assign other district users the Roster Approver permission
- Take control of a school's rosters
- View a teacher's rosters
- View the history of a teacher's rosters
- Edit a teacher's rosters
- Mark rosters as eligible or ineligible
- Add and remove rosters for a teacher
- Copy a roster
- Apply a percentage of instructional time to every student on a roster
- Batch print overclaimed and underclaimed students
- Return a school's rosters to the school
- Approve rosters that you have verified
- Submit your district's rosters
- Understanding the RV Pages
- Viewing the History of Actions on Rosters
- Additional Resources
- General Help
Teacher Value-Added
Understanding the Report
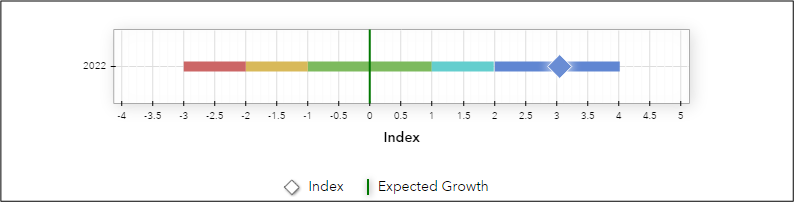
Growth Index
The growth index is a reliable measure of whether students exceeded, met, or fell short of expected growth. This value takes into account the amount of growth the students made as well as the amount of evidence above or below expected growth. Specifically, the growth index is the growth measure divided by its standard error.
The table includes the growth index values for up to three years and the multi-year average, when sufficient data is available. These values are plotted as color-coded diamonds in the growth index graph at the top of the report.
District Average
The option to display District Average is available when there is sufficient data. The District Average appears as a vertical purple line. This value represents the average of all teacher index values in the district for the selected grade and subject or course.
Effectiveness Levels
Each growth index is color-coded to indicate how strong the evidence is that the students exceeded, met, or fell short of expected growth.
The key at the bottom of the report provides guidance for interpreting the colors.
| Effectiveness Level | Growth Index Value | Interpretation |
|---|---|---|
| Level 5 - Most Effective | 2.00 or higher | Significant evidence that the teacher's students made more progress than expected growth |
| Level 4 - Above Average Effectiveness | Between 1.00 and 2.00 | Moderate evidence that the teacher's students made more progress than expected growth |
| Level 3 - Average Effectiveness | Between -1.00 and 1.00 | Evidence that the teacher's students made progress similar to expected growth |
| Level 2 - Approaching Average Effectiveness | Between -2.00 and -1.00 | Moderate evidence that the teacher's students made less progress than expected growth |
| Level 1 - Least Effective | Less than -2.00 | Significant evidence that the teacher's students made less progress than expected growth |
Growth Measure
Each growth measure is a conservative estimate of the academic growth the students made, on average, in a grade and subject or course. The growth measure is based on students that were linked to the teacher and the percentage of instruction. Because the growth measures are estimates, consider their associated standard errors as you interpret the values.
The growth measure is calculated differently for assessments analyzed with the gain model than it is for assessments analyzed with the predictive model.
See also: Measuring Growth.
Standard Error
All growth measures on the TVAAS reports are estimates. All estimates have some amount of measurement error, which is known as the standard error. This value defines a confidence band around the growth measure, which describes how strong the evidence is that the group of students exceeded, met, or fell short of expected growth.
For more information about standard errors, see Growth Measures and Standard Errors.
Expected Growth
Expected Growth represents the point at which the students' scores, on average, align with expectations.
Expected Growth signifies the minimum amount of academic growth that educators should expect a group of students to make in a subject and grade or course. In general, this signifies appropriate, expected academic growth. Simply put, the expectation is that regardless of their entering achievement level, students served by each district, school, or teacher should at least make enough progress to maintain their achievement level relative to their peers. This is a reasonable target for educators who serve all types of students. Expected Growth is represented by a vertical green line in the graph.
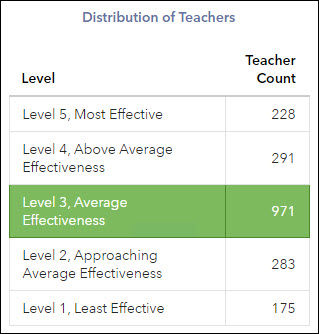
Distribution of Teachers
This distribution lists the number of teachers in each effectiveness level in the selected grade and subject or course statewide. This enables each teacher to compare their teacher value-added results with other teachers in the state for the same grade and subject or course. It's important to understand that TVAAS does not fit teachers into a predetermined distribution. The number of teachers who appear in each effectiveness level is determined by the amount of statistical evidence that each teacher's group of students exceeded, met, or fell short of expected growth. The methodology does not predetermine the number or percentage of teachers whose values fall into each effectiveness level range. In fact, the relative size of each effectiveness level group varies by grade and subject or course, depending on the evidence of measurable differences in growth. |
|
Student List
To see the list of students linked to the teacher in the data, click the Student List button above the chart. Students are listed alphabetically by last name.
The Used in the Analysis column indicates whether each student was used in the analysis that generated the teacher's value-added report. The most common reasons that students are excluded from the analysis are:
- They don't have assessment scores
- They aren't linked to a teacher
- They don't meet membership or attendance rules
- Their scores are outliers
- They are new to the state
- They don't have enough prior assessment data
Some of these exclusion rules might not apply to all subjects. Statistical Models and Business Rules describes various conditions that can cause a student to be excluded from the analysis.
Only students marked F for instructional availability during the claiming process are included when calculating teachers' value-added measures. This information is available in roster verification.
Teachers who have a Teacher Value-Added report in the selected subject, grade, or course in the most recent year have access to this report.
Showing the Growth Index or Growth Measure
The report displays the growth index graph by default. You can choose the growth measure graph from the menu below the graph. For more information about the growth measure graph, see Interpreting the Data.